SharePoint Diagnostic Studio 2010
Although I installed the SharePoint Administration Toolkit some time ago I’ve only just found the time to have a good look at what it includes. And I’m glad I did, as I discovered The SharePoint Diagnostic Tool.
The main role of the diagnostic studio is to run reports that can aid a SharePoint administrator in monitoring the health of a farm and track down issues by gathering information and delivering this in a unified view in a single interface.
SPDiag provides a selection of predefined reports, and these are broken down into five categories; Base, Capacity, Performance, Availability and Usage.
Follow these steps to get started and create some reports:
- Open SharePoint Diagnostic Studio and click New Project
- Enter the server name and click Create Project (you may need to wait while some components are installed)
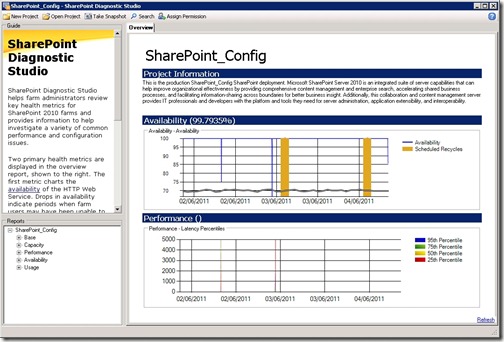
- The following screen is generated to give an overview:
In order to create reports just expand the tree view in the Reports Pane, bottom left, and double click the desired report. Depending on your setup they may take a few minutes to run.
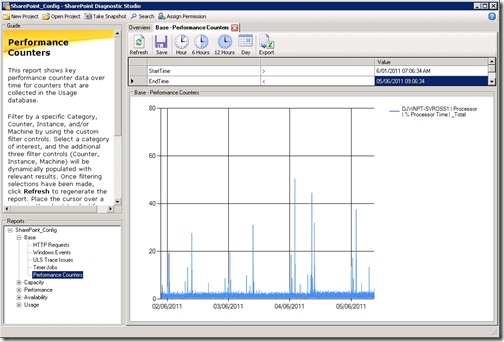
The following is a screenshot of the Performance Counters report:
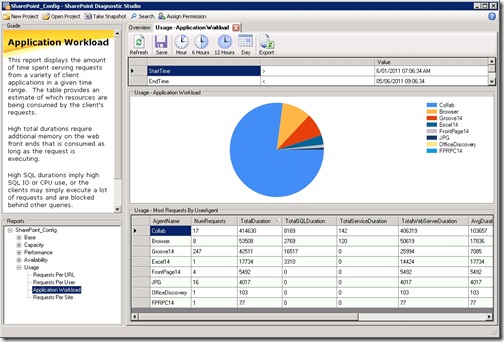
The following is a screenshot of the Application Workload report:
Note: Be weary of the American date format when creating reports – this always throws me! I haven’t found a way to correct this yet.


![[BlogBookmark]](http://www.adventuresinsharepoint.co.uk/wp-content/plugins/bookmarkify/blogbookmark.png)
![[Blogsvine]](http://www.adventuresinsharepoint.co.uk/wp-content/plugins/bookmarkify/blogsvine.png)
![[del.icio.us]](http://www.adventuresinsharepoint.co.uk/wp-content/plugins/bookmarkify/delicious.png)
![[Digg]](http://www.adventuresinsharepoint.co.uk/wp-content/plugins/bookmarkify/digg.png)
![[Facebook]](http://www.adventuresinsharepoint.co.uk/wp-content/plugins/bookmarkify/facebook.png)
![[Furl]](http://www.adventuresinsharepoint.co.uk/wp-content/plugins/bookmarkify/furl.png)
![[Google]](http://www.adventuresinsharepoint.co.uk/wp-content/plugins/bookmarkify/google.png)
![[LinkedIn]](http://www.adventuresinsharepoint.co.uk/wp-content/plugins/bookmarkify/linkedin.png)
![[MySpace]](http://www.adventuresinsharepoint.co.uk/wp-content/plugins/bookmarkify/myspace.png)
![[Reddit]](http://www.adventuresinsharepoint.co.uk/wp-content/plugins/bookmarkify/reddit.png)
![[Slashdot]](http://www.adventuresinsharepoint.co.uk/wp-content/plugins/bookmarkify/slashdot.png)
![[StumbleUpon]](http://www.adventuresinsharepoint.co.uk/wp-content/plugins/bookmarkify/stumbleupon.png)
![[Twitter]](http://www.adventuresinsharepoint.co.uk/wp-content/plugins/bookmarkify/twitter.png)
![[Windows Live]](http://www.adventuresinsharepoint.co.uk/wp-content/plugins/bookmarkify/windowslive.png)
![[Yahoo!]](http://www.adventuresinsharepoint.co.uk/wp-content/plugins/bookmarkify/yahoo.png)
![[Email]](http://www.adventuresinsharepoint.co.uk/wp-content/plugins/bookmarkify/email.png)
I get this message when trying to create a project:
Re-installing didn’t fix it.
Westy, you need to enable Usage and Health Data Collection for your farm. To do this go to Central Administration -> Monitoring -> Configure Usage and Health Data Collection
Could you confirm, before I tear my hair out, that dates shoul be supplied in the format mm/dd/yyyy? The date picker seems to be doing its own thing, so I’m trying to avoid it!
Yes, that’s correct. I can’t find a way to change the dates to UK format.
Thanks Dave this worked for me “Configure Usage and Health Data Collection”
Thanks a bunch for sharing this with all
folks you actually realize what you are speaking approximately!
Bookmarked. Kindly additionally seek advice from my website =).
We could have a link alternate agreement among us